Assignment 2
EAE2122
Synoptic situation
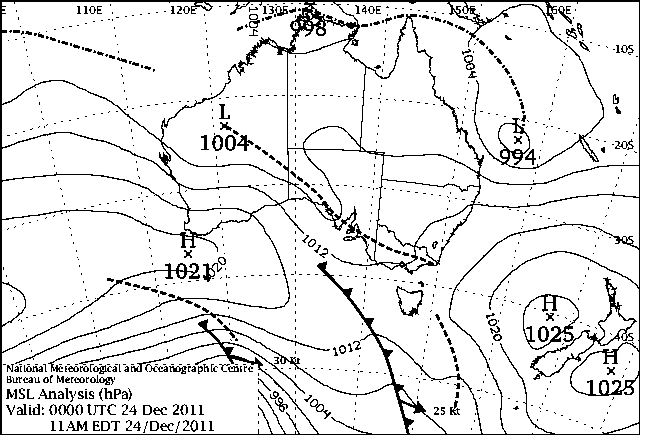
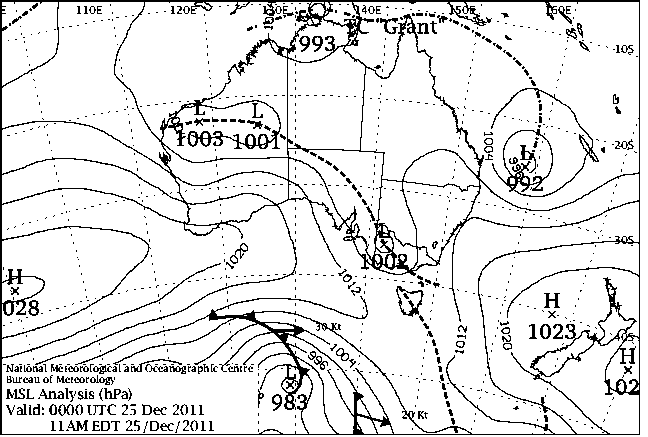
The figures below show the synoptic situation in the lead up to the severe weather event. Plotted are the mean sea-level pressure as well as the positions of fronts and troughs as analysed by the Bureau of Meteorology.

Fig. P2a: MSLP chart for 0000UTC 24 Dec 2011.

Fig. P2b: Forecast MSLP chart for 0000UTC 25 Dec 2011.

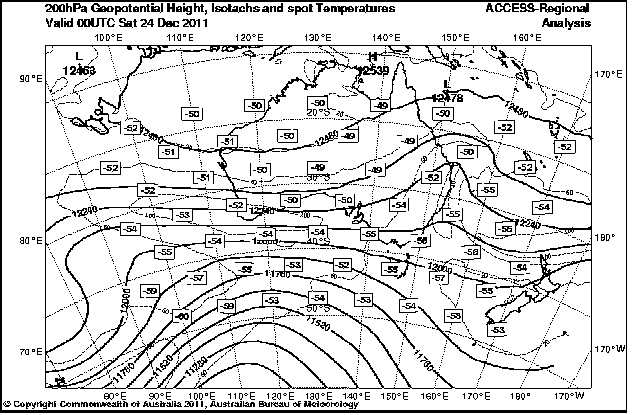
Fig. P2c: Geopotential at 200 hPa for 0000UTC 24 Dec 2011.